Conditional Formatting (Fx) in PowerBI Custom Visual
- Puttarak Khwan
- Tools , /thcategories/tools Microsoft , /thcategories/microsoft Automation /thcategories/automation
- 13 Apr, 2021
👋 Hi Everyone 👋 During this time, I have a chance to implement the PowerBI Custom Visual with my team. And we spent a lot of time researching the conditional formatting (Fx) and we found many interesting things. I hope this blog can help everyone who interested to implement this feature in PBI Custom Visual.
Prerequisite:
- In this blog, I create an example visual following this document. Please create an app follow this tutorial before going to the section below. Or you can clone an example visual from my repository.
- Due, I use ReactJS to create a custom visual. So, you have to know about the basics of React too.
Let’s start !!
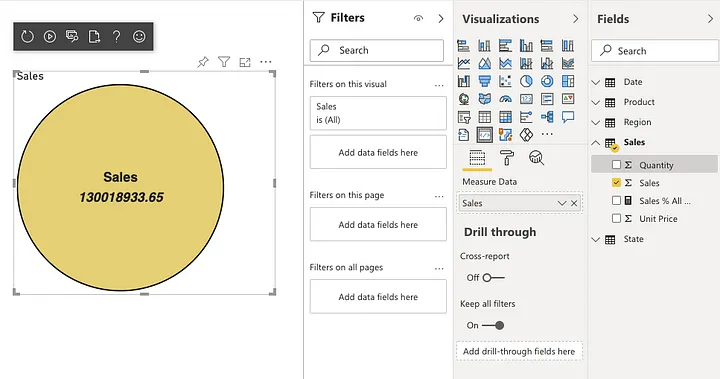
- Once you create or clone the ReactCircleCard visual, you should able to run & see like this screen.
- Next, open the package.json file and update the
powerbi-visuals-apias3.6.0and add thepowerbi-visuals-utils-dataviewutilsas2.4.1. Due to the conditional formatting feature is available in API v.3.6.0+
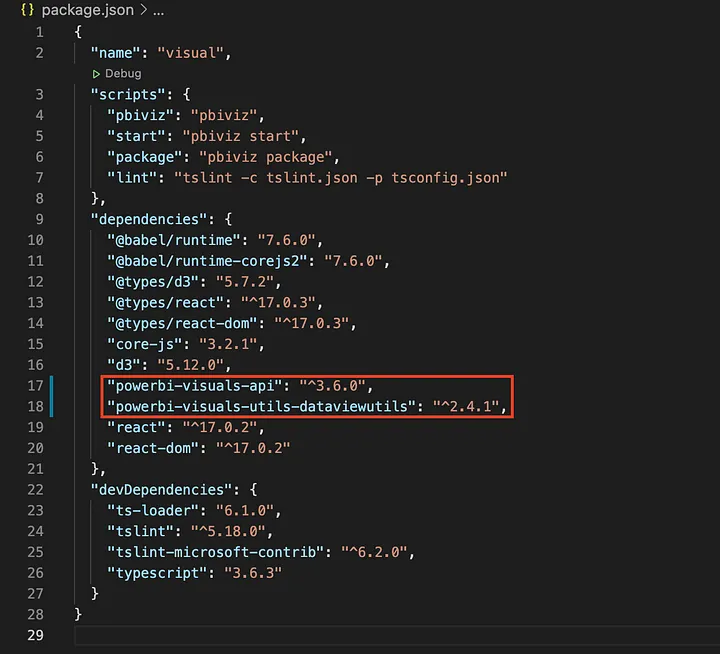 package.json file
- Next, update the “apiVersion” to 3.6.0 in pbiviz.json file.
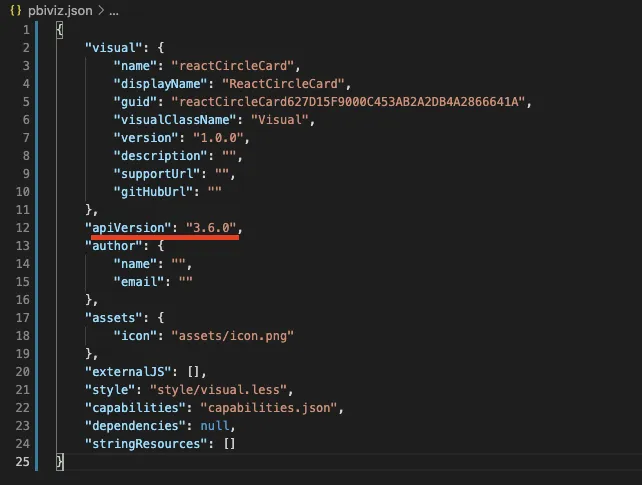 pbiviz.json file
-
Run
npm installto update libraries in your node_module again. -
Then, import the code at the top of
visual.tsfile.
import { dataViewWildcard } from "powerbi-visuals-utils-dataviewutils";
import VisualEnumerationInstanceKinds = powerbi.VisualEnumerationInstanceKinds;- Next, edit the enumerateObjectInstances method in visual.ts file like code below. At this point, we gonna use properties which come from capabilities.json file to show up the conditional formatting feature in fill property.
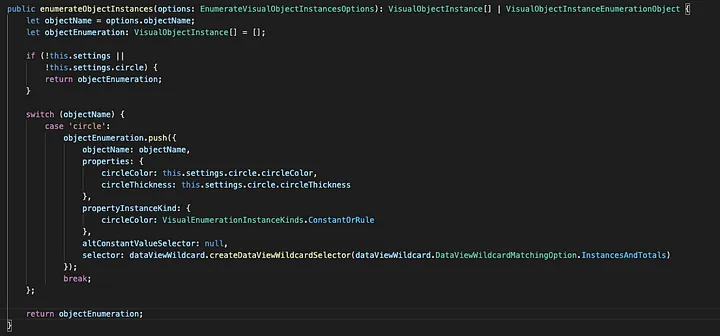 Edit the enumerateObjectInstances method to support the conditional formatting feature
At this step, you have to make sure all properties in capabilities.json are declared & bind this.setting parameter in the enumerateObjectInstance method.
- Add the visualTransform method that will parse a color value from
DataViewand bind the new value tothis.setting. After that, callvisualTransformmethod inupdate()& fix minor code like below.
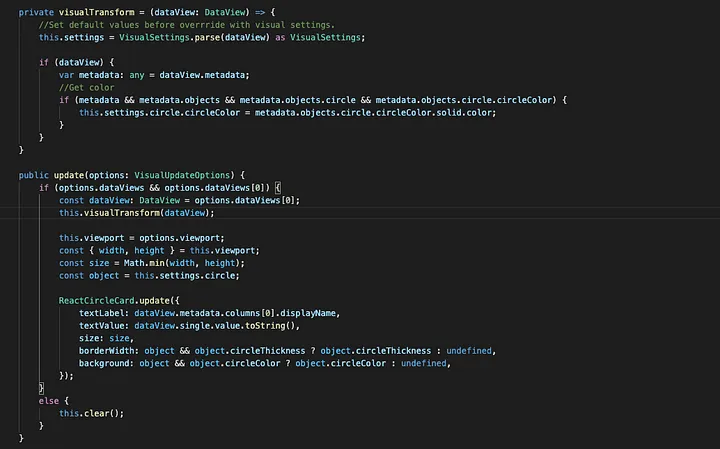
- When you refresh a custom visual in PowerBI report, you will able to see the conditional formatting feature in the color section.

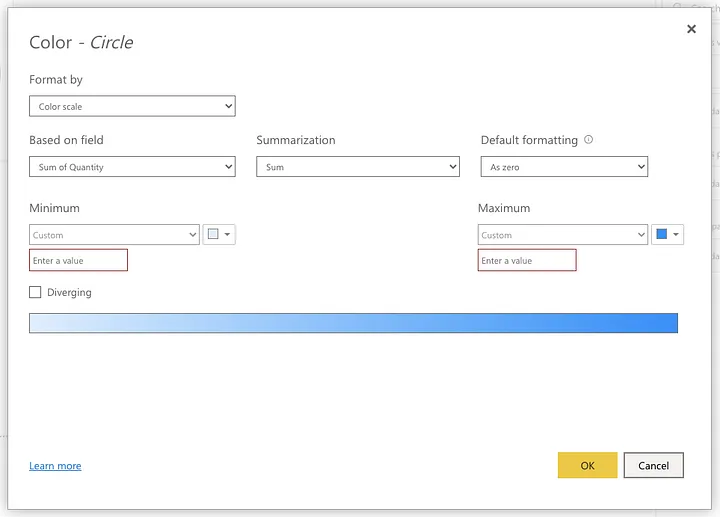
- When you click on the
FXbutton, it will popup the conditional formatting dialog and you can set the color scale based on the value field.
- If you add the color scale in conditional formatting, This value will appear in
dataViewobject.
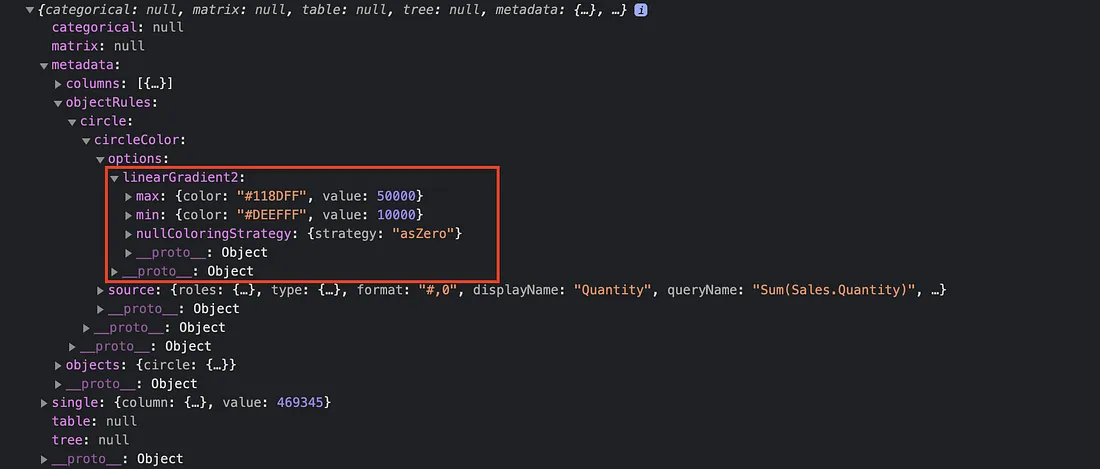 DataView return the Color Range
- So, you can get code colors & values for Min/Max and apply this to your visual later.
Note: You can clone this project (with FX feature) via this link: https://github.com/iamkhwan/Tutorial-ReactCircleCard/tree/conditional-formatting
Limitations/Need to know in PowerBI API 3.6.0
-
As I tried to get the rule value from the conditional formatting, The Categorical data type only can able to get the value of the
Rulesin conditional formatting. (I attempted to get it in Single/Table/Matrix that don’t work) -
Single/Table/Matrixcan get only the color scale value like the example in this blog. -
The conditional formatting feature can show in Field tab only. It can’t show up in the Fields tab like
Matrixvisual can do.
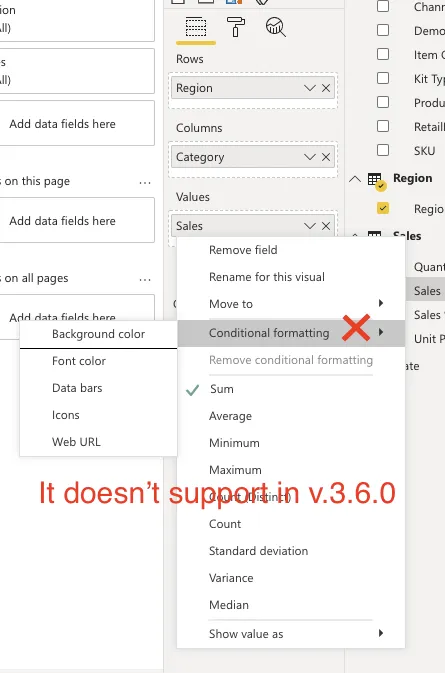
Finally, you can show the conditional formatting feature in a custom visual app. I hope this content will help & guide you to develop your custom visuals. YAYYYYY
👋 See ya next times 👋
References:
- https://docs.microsoft.com/en-us/power-bi/developer/visuals/create-react-visual
- https://docs.microsoft.com/en-us/power-bi/developer/visuals/conditional-format
- https://github.com/iamkhwan/Tutorial-ReactCircleCard
- https://community.powerbi.com/t5/Developer/How-to-show-the-Conditional-Formatting-option-in-Fields-tab/m-p/1754342#M28693


